

Great Returns Should be a Consequence… Enter cARR!
Turning Paper Marks into Real Performance


Are paper markups a real thing?
Venture Capital is a decade‑long game that pays out only at the finish line. Unicorn press releases, triple‑digit paper markups and unrealized IRRs feel great at the moment, but they are only signals that a fund might be heading in the right direction, never the ultimate goal. Chasing the “next hot thing” can dress up a portfolio with quick markups, yet if the gains are not followed by profitability and durable growth, they divert attention from the work that truly matters: bringing DPI to LPs.
Valuation marks swing with macro cycle, liquidity tides and FOMO, relying solely on them is risky. When managers anchor decisions to those signals, judgment drifts away from fundamentals.
Whenever a markup excites us, we remind ourselves the game is still on. We return to first principles and focus on the levers we control. Realizing we lacked a metric to track those levers, we decided to build one.
At SaaSholic, we operate with a simple belief: our job is to help our companies grow.
Whether that means refining pricing, hiring a CRO, reducing burn, making a hard call, like parting ways with a co‑founder or writing off a segment of revenue, we show up for the work.
Bill Walsh, the legendary coach who turned the San Francisco 49ers from 2‑14 into a dynasty, captured this mindset in The Score Takes Care of Itself1. He insisted on “Standard of Performance”: precise practice scripts, clean locker rooms, and relentless attention to detail. His lesson is simple: concentrate on the process, and the scoreboard will follow.
For the same reason our monthly portfolio reviews ignore fund optics and paper money. They focus on one thing: how are our companies evolving? What did we help improve? What do we need to fix next?

Introducing cARR: A Metric That Keeps Us Honest
Traditional metrics such as MOIC and IRR are backward‑looking. They update only after a financing event and can arrive months or even years later. We needed a real‑time pulse that shows, month by month, whether each company is compounding value the way we expect and tells us what to do next.
That’s why we created cARR, the Cost of Annualized Run Rate.
cARR = Total Capital Invested / (Current ARR x Current Ownership %)
The formula answers a single question: How many dollars have we invested for every dollar of Run Rate Revenue we still own today?
cARR gives us three actionable insights:
Growth support - Are we helping our companies scale the right way?
Pricing discipline - Did we value this investment properly at entry?
Ownership retention - Have we been too diluted?
We don’t aim to minimize cARR on day one; we expect it to fall over time. After a few years, a low and declining cARR is a strong signal that we are on the right path and returns will follow.
A low cARR reflects disciplined entry pricing, limited dilution and effective growth.
A high cARR flags one of three gaps: overpayment, sluggish revenue or excessive dilution, and shows exactly where we should focus next.
Because cARR improves as companies grow, we don’t need new rounds or external validation to provide us with feedback. It rewards real traction rather than market swings.
Rolled up across the fund, it offers an honest snapshot of portfolio maturity and capital efficiency. That's our real north star metric.
The VC “Margin of Safety”
We’re building a playbook poised to deliver strong returns in any markets, without hoping for exit multiples to expand. Latin America is capital-constrained, and most exits occur in the 3-6x ARR range, therefore counting on peak valuations is unsustainable. A successful VC model requires the margin of safety to deliver returns even during harsh market conditions.
cARR keeps us grounded in what we can control: the price we pay and the speed at which our capital turns into durable revenue. SaaS multiples swing dramatically2, but our discipline cannot.

Although we back future category leaders that we expect to command premiums above median valuations, our model must still work even if markets trade at the lows when exit time comes. cARR shows whether growth and capital efficiency are converging fast enough to make that true.
What “Great” Looks Like
We have defined what winning looks like in cARR standards. Our targets are:
Deal-by-deal: cARR < 1 within 3 years
Fund-level (aggregate): cARR < 1 by year 7. Non negotiable.
A simple example
We invest in a company with $1M ARR at a $6M valuation. That means our entry cARR is $6. Our expectation is that ARR should grow to at least $6M within no more than 3 years, pushing cARR to 1.0, our baseline success mark.
If it gets there faster? Awesome, we might be doing something well. If it takes longer or falls short? We dig in to understand what went wrong and how to correct our course.
It’s important to note that a cARR <$1 is good, but does not mean our job is done. Companies can still disappoint by flattening the growth at sub-scale size (low liquidity) or because they got there in an unsustainable way. No metric is perfect, but we believe this can be a good one.
This model reflects discipline and realism. We don’t need every company to be a unicorn. We just need them to grow into the price we paid, then keep executing.
Our goal is not to minimize cARR at the time of the investment. Chasing artificially low entry prices can make cARR look great on day one, yet mask adverse selection, companies that are cheap for a reason. We seek to bring it down as fast as possible after our investment is done.
To guide that work, we mapped an “optimal cARR curve” that sets “Ok”, “Good” and “Great” bands for each year of the fund life, at both company and portfolio levels.

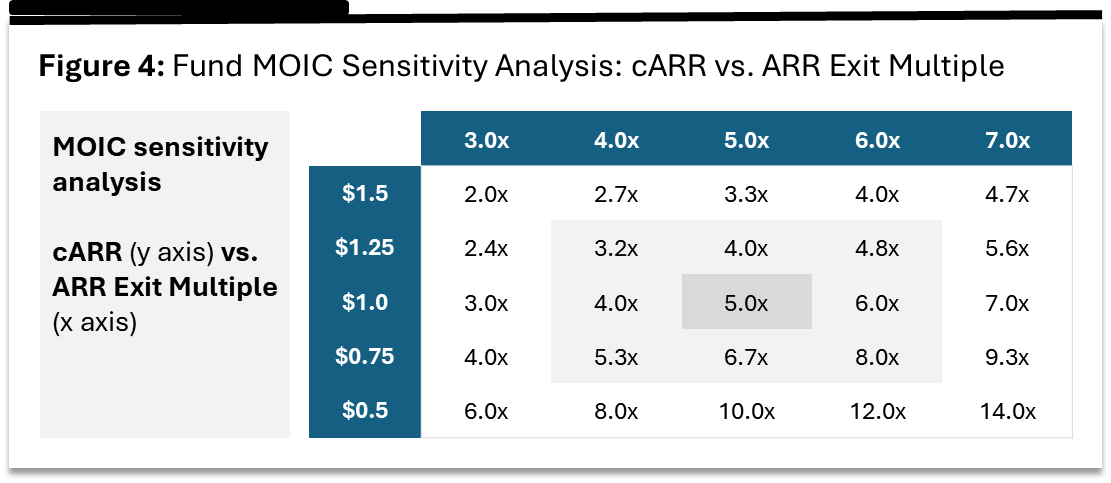
Achieving these audacious thresholds means we backed great companies at reasonable terms, and helped them grow the right way. Ultimately, we’ve followed Bill Walsh’s advice: "Concentrate on what will produce results rather than on the results, so results become a consequence." The analysis in Figure 4 projects the potential fund-level returns if we stay on that curve.
Returns Follow the Work
Our goal is a model that performs in bull and bear markets, without depending on perfect conditions. By helping founders compound revenue and drive cARR lower each quarter, we let fundamentals guide us instead of hype.
Sharing this framework invites the ecosystem to track progress through an execution-driven lens and gives founders, VCs, and LPs a tool that highlights operational fundamentals while cutting through the noise.
Bill Walsh, Steve Jamison, and Craig Walsh, The Score Takes Care of Itself: My Philosophy of Leadership (Portfolio, 2009)
Public cloud software valuation history and multiples come from the BVP Nasdaq Emerging Cloud Index. Data downloaded 30 June 2025.