


The best SaaS companies in the world built their empires on an assumption that a retained customer is a profitable customer. With zero marginal costs, every dollar that renewed dropped straight to the bottom line. Net Revenue Retention became the definitive health check, and if NRR was above 120%, the business was compounding.
That logic held for 20 years until AI broke it, and as we argued in The ARR Challenge, software now has real physics. Every interaction carries an inference cost, and the “all-you-can-eat” subscription model is giving way to consumption-based pricing that better reflects this reality.
The implications go beyond pricing. They change what retention itself means. A customer that renews in an AI business is not automatically profitable because AI workloads carry real infrastructure weight. NRR can be 120% while the economics underneath quietly deteriorate.
There is a more fundamental problem with aggregate NRR: it compresses your entire customer base into a single number. Early-stage accounts still figuring out the product get averaged with mature accounts that have rebuilt workflows around it. A small group of power users expanding aggressively can offset a larger group quietly reducing usage or churning altogether. The headline number can look healthy even when the underlying distribution is falling apart.
Retention in AI requires answering two questions. Who actually stayed, and can you afford to keep them?
The Behavioral Reality
a16z published two great pieces on this problem. In “Retention Is All You Need“ and “The Cinderella Glass Slipper Effect“, they analyzed hundreds of AI companies and identified a pattern that traditional SaaS metrics weren't built to capture: the first months of an AI product’s life are structurally different from what comes after.
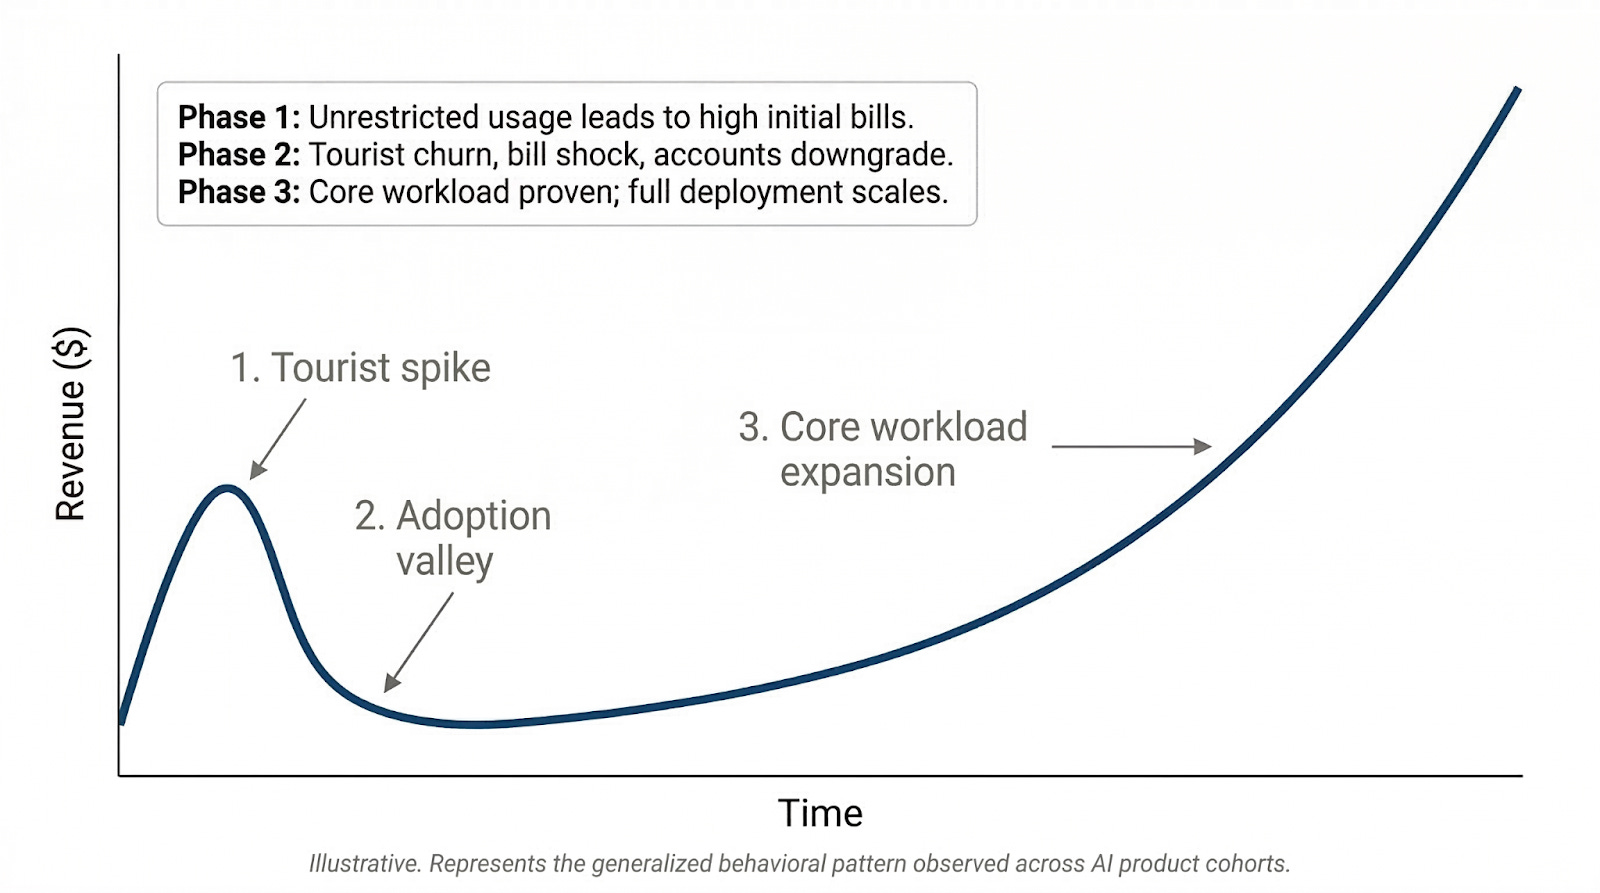
When an AI product launches or a new model drops, a wave of users signs up. Some are genuinely searching for a tool that solves a deep workflow problem, but many others are what a16z calls “AI tourists,” curious experimenters who try the product for a few weeks, don’t find an immediate fit, and move on. The initial revenue picture looks encouraging because both groups are active, generating usage and spend. Then the tourists leave, accounts downgrade, and revenue dips. This is the adoption valley, and it terrifies founders who mistake a structural phase for a product failure.
In an empirical study with OpenRouter1 analyzing over 100T tokens of real-world LLM usage, the earliest users of Claude Sonnet and Gemini Pro retained roughly 40% by month 5. Cohorts that arrived just a few months later churned almost entirely. The difference comes down to timing, rather than product quality. The survivors, or “foundational users,” are the ones who found a genuine fit between the product and a real workload. When they lock in and start rebuilding processes around the tool, usage compounds and revenue recovers, often exceeding the initial tourist-inflated peak.
This is why the best practice is now rebasing retention calculations from Month 0 to Month 3. The first three months are noise that tells you very little about long-term health. The real signal begins when the tourists have left and you can measure the foundational cohort on its own. When an AI product truly nails a workflow, these cohorts can retain and expand at rates that rival the best traditional SaaS.
Understanding who stayed is necessary work that still falls short of the whole picture.
The Financial J-Curve
In traditional SaaS, there was really only one J-curve. You burned cash to acquire a customer and then served them at a marginal cost close to zero, so the curve bent upward on its own as long as you held onto the account.
AI inverts this. The cost to serve a retained customer scales with their usage because every query triggers inference and agent runs consume tokens. As AI products improve and costs per token drop, customers use dramatically more of them (Jevons Paradox) as workloads get deeper and agents get chained together in ways that multiply resource consumption, so the efficiency gains flow into heavier usage rather than margin expansion.
Under consumption pricing, more usage does mean more revenue, yet a company running entirely on third-party model APIs ties its margin trajectory to someone else’s pricing roadmap. Token costs have been falling and will likely continue to, but every company on the same API captures the same deflation - so, there is no structural advantage!
The financial J-curve bends upward only when you reduce the cost per unit of value faster than customers increase their consumption.
This means your most valuable customers are also your most expensive to serve. We have a phrase for this at SaaSholic: retention without margin is charity.
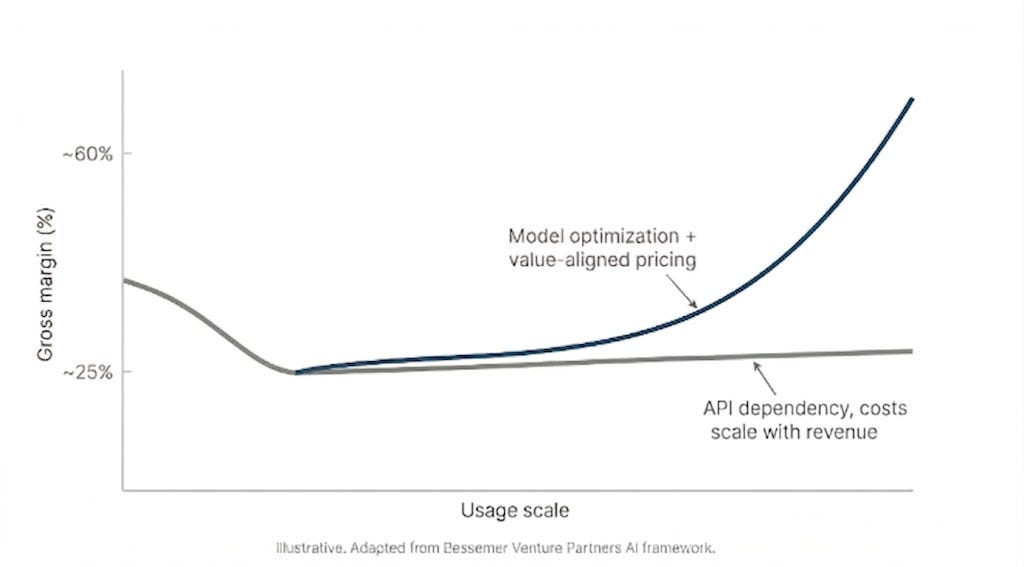
Bessemer Venture Partners offers a useful framework for this trajectory2, by splitting AI companies into “Supernovas,” early-stage companies running at ~25% gross margins with unoptimized infrastructure, and “Shooting Stars,” mature companies that have reached ~60% after deliberate work on cost structure and pricing. The distance between those two stages is the financial J-curve.
That framework reflects the US growth-stage reality. In Latin America, the starting point is likely steeper. Most seed-stage AI companies in the region are fully dependent on third-party APIs with no scale leverage on pricing, operating with smaller revenue bases where fixed infrastructure costs hit harder per unit. The path from Supernova to Shooting Star is longer here, which makes cost-to-serve discipline even more urgent.
You cannot wait for scale to solve the margin problem, you have to engineer it early.
The chart below shows two paths from the same starting point. Which one a company lands on is not a matter of luck or market timing. It is a matter of whether the team treats margin as an engineering priority from day one, or assumes that growth will eventually solve the problem - which is unlikely to happen.
The Takeaway
We truly believe that the AI winners will be the ones that can open their cohort data and show two things: a customer base that survived the behavioral valley and moved from experimentation to core workload, and unit economics that are improving rather than compressing as that base scales. The first without the second is a growth story with an expiration date.
This is what we look for and it shapes how we advise our founders to build their metrics infrastructure from day one. The aggregate dashboard is not enough. What matters is isolated monthly cohort data that tracks both retention and contribution margin trajectory over time. If your Month 6 cohort is retaining well but costs the same per user to serve as your Month 1 cohort, the financial curve is flat and growth will not fix it.
There are some cost-improvement levers available today. Founders should be routing queries by complexity so that expensive frontier models only handle what simpler models cannot, caching repeated inference to avoid paying twice for the same answer, and investing early in fine-tuned models for the highest-frequency tasks.
On the pricing side, the goal is aligning revenue capture with the value delivered so that heavier usage generates proportionally higher margin, rather than offering flat access that subsidizes your most active accounts.
The bar is higher than it was in traditional SaaS. But for the founders who clear it, the prize is larger because consumption-based models uncap the revenue ceiling in a way that seat-based pricing never could.
If you are building a business that fits this vision, we’d love to learn more!
https://openrouter.ai/state-of-ai
https://www.bvp.com/atlas/the-state-of-ai-2025